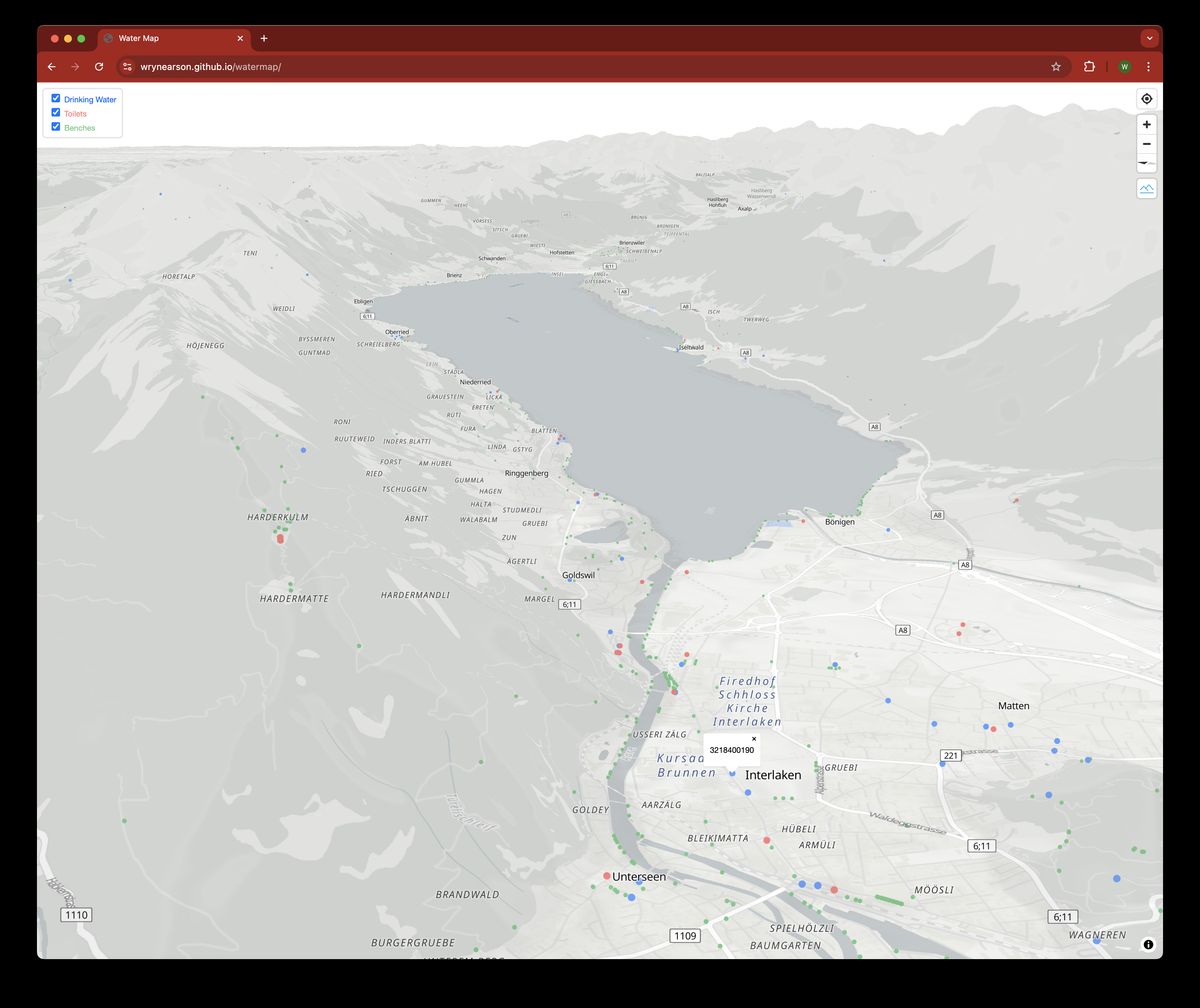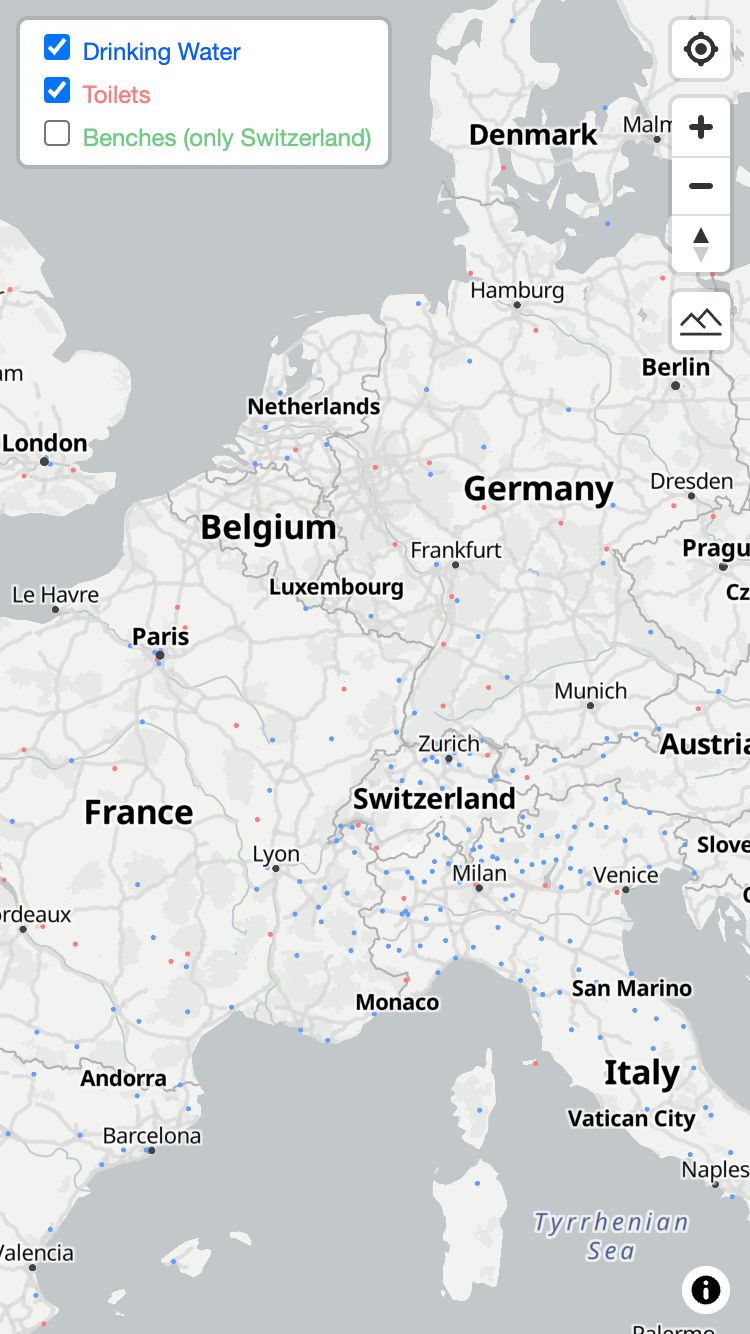
Switzerland and many European countries are blessed with public drinking water sources. I usually have a reusable bottle with me when out and about, but sometimes it takes some searching to find a nearby fountain to fill up.
Continuing with my frontend mentorship streak, I decided to build a map myself.
I had a few goals in mind:
- Keep it as simple as possible (both in terms of code and features).
- Make it work well on mobile devices (primarily, make it load quickly).
- Have zero operating costs.
How it works
There were several steps needed to get this working.
- Get the data
- Process
- Optimize the data
- Show the data on a map
- Host the site
1. Get the data
OpenStreetMap is always a good place to start with this specific type of geospatial data.
OSM features uses tags to describe features of map elements. I don't know of a way to only download elements with specific tags from OSM, and having the most up-to-date information isn't required, so I looked at downloading all OSM data. This is provided, but at 78GB, it's quite a lot of data to work with on this supposedly-simple project.
Luckily, GeoFabrik offers regional extracts of OSM Planet data. The data for Switzerland, where I live, is less than 500MB. This seemed like a good place to start.
2. Process the data
Once I had a nice switzerland.osm.pbf, I then tried to figure out how to extract only the data I needed (drinking water, and later toilets and benches). Osmium is a powerful CLI tool to process .pbf files and extract data based on tags.
osmium tags-filter switzerland.osm.pbf drinking_water=yes, amenity=drinking_water -o drinking_water.pbf
The tags-filter lets you pass one or more tags to extract. Here, Osmium checks for any drinking_water key with the value of yes, or any amenity key with the value of drinking_water. OSM tags are user-defined, but amenity=drinking_water and drinking_water=yes seem to be the two used in practice. I repeated the process with amenity=toilets and building=toilets for public restrooms, and amenity=bench and leisure=picnic_table for places to sit.
Now our output pbf files (drinking_water.pbf, toilets.pbf and benches.pbf) are each around 1MB, a 99%+ reduction.
3. Optimize the data
The data should be optimized in at least two ways:
- The amount of data shown at one point shouldn't be overwhelming.
- The amount of data the browser needs to download should be minimized.
From my limited technical ability, and keeping things simple (goal 1), tiling seemed like the best approach. That way, enough data is shown without having to download the whole dataset.
Tippecanoe is an open-source CLI tool to tile geospatial datasets. PBF is not a supported input filetype (AFAIK), so the exported PBF needed to be converted into a format that Tippecanoe supports.
Python and Geopandas seemed like a good tool for this task. After some trial and error, I came up with an approach:
- Load exported PBF
- Loop through "layers" in the PBF (element types, which include
points,lines,multilinestrings(not commonly used AFAIK), andmultipolygons) - Export layers as individual GeoJSON files (as
{layer}.geojson)
layers = ['points', 'lines', 'multilinestrings', 'multipolygons']

gdf_list = []

# Iterate through the layers and read each one
for layer in layers:
    try:
        # Read the layer from the PBF file
        gdf = gpd.read_file("../data/raw/output/europe_toilets.pbf", engine="pyogrio", layer=layer)

        # Add a new column to indicate the layer
        gdf['layer'] = layer

        # Append the GeoDataFrame to the list
        gdf_list.append(gdf)

        # Optionally print the first few rows of the GeoDataFrame
        print(f"Layer: {layer}, Number of features: {len(gdf)}")

        # Export the layer as a separate .geojson, to later add as tile layers in tippecanoe

        if len(gdf) > 0:
            export = gdf[["osm_id", "geometry"]]
            export.to_file(f"../data/raw/geojsons/{layer}.geojson", driver="GeoJSON")
        else:
            print(f"Nothing to write to {layer}.geojson. Skipping...")
    except Exception as e:
        print(f"Failed to read layer {layer}: {e}")
The full process is written in this Jupyter Notebook, and is repeated for each of the three categories (drinking water, toilets, and benches).
Then, Tippecanoe is used to load the GeoJSON files. One tile set is created for each data type. This could probably be one tile set for all categories. I played around with some of the various flags and settings to try to get the appearance of the tiles to balance data accuracy while not overwhelming users.
tippecanoe -z14 --drop-densest-as-needed --extend-zooms-if-still-dropping --no-tile-compression --output-to-directory=drinking_water/ raw/geojsons/lines.geojson raw/geojsons/multipolygons.geojson raw/geojsons/points.geojson -B 12
Let's break this down:
z14creates tiles up to zoom level 14. Creating higher zoom level tiles exponentially increases the file size or number of tile files.z14adequately showed all data without missing detail in this use case.--drop-densest-as-neededand--extend-zooms-if-still-droppinghelp to reduce the file size of the tile set, especially at low zoom levels.--no-tile-compressionbecause apparently GitHub Pages doesn't support compressed tiles.--output-to-directorygives us a bunch of small files, instead of a single file. I think this is also needed to get this working with GitHub Pages.-B 12ensures that all data is loaded at zoom level 12. I was having some issues with not having all data appear at higher zoom levels, and this seemed to fix it.
4. Show the data on a map
Thinking of goal 1 again, the map is build with Javascript (no frameworks) using MapLibre. Even more simply, the JS code is written directly in the index.html file.
When the page loads, the map loads, with viewport defaulting to a view of Europe.

All three sources (drinking water tiles, toilet tiles and bench tiles) are added as individual sources in MapLibre. Then, each layer from each source (points, lines, multilinestrings and multipolygons) are added as layers in MapLibre. Each source type shares a color, but the layers have different styling (shared across source type).
Attentive readers might have noticed that the osm_id was kept in the data optimization step – if a point is clicked, its OSM_ID is shown in a tooltip. It would be better to link to the OSM feature through the tooltip.
The basemap is from OpenFreeMap.
MapLibre has a built-in NavigationControl which lets the map access the user's location if they choose to permit it.
5. Host the site
As eluded to earlier, this site is hosted at a GitHub Page. Every time I commit to main, the site is re-built. Tiles are stored and loaded from GitHub, and the total hosting cost is $0. Easy!
Extras
Going against goal 1, I thought about adding more features. The first was to add toilets and benches (already mentioned), which means the name doesn't really make sense anymore...
I then realized that I'm often looking for water / toilets / benches while doing some sport in the mountains. Adding elevation data to create a 3D map would help determine if the desired feature was uphill or downhill. I added this from Tilezen and sources, but then realized it was going against goal 2 by having to load terrain data, so a terrain toggle was added to reduce initial loading times.
Thoughts and next steps
I think this turned out quite well! It was a great way to learn how to work with large OSM datasets, create map tiles, and build a map using MapLibre. While the scope did increase to include more data types, I think it still sticks to the core vision of being able to see where key features are quickly and in your proximity. The map and data load in under 4MB (most of that coming from the basemap from what I can tell) There are no operating costs – thank you to the open source contributors of the various libraries and datasets used, and to GitHub for supporting free hosting.
This post covers adding data for Switzerland, but data for all of Europe is currently on the map. Adding data globally would be nice, but I think I was pushing the limits of the number of changes in a commit that GitHub appreciates. I'm not sure if I'd run into diff size limitations or timeouts if trying to add more tiles.
Updating the data periodically would be nice as well. Automating the data processing and tiling steps would help make this easier.
For other ideas, please see the Issues section of the repo. Feel free to open an issue yourself!